Manchester City's 5-2 win over Tottenham Hotspur last month was chalked off as a regulation win. Dominating possession, scoring five goals, the game ended in an uncontested win for the league leaders. But the game beneath the scoreline tells a different story. Tottenham created more chances. They generated more xG (expected goals). And yet the scoreline read 5-2 to City. So what actually decided this game and what does it tell us about how a football game is really won and lost? The answer starts with one metric - xG or expected goals.
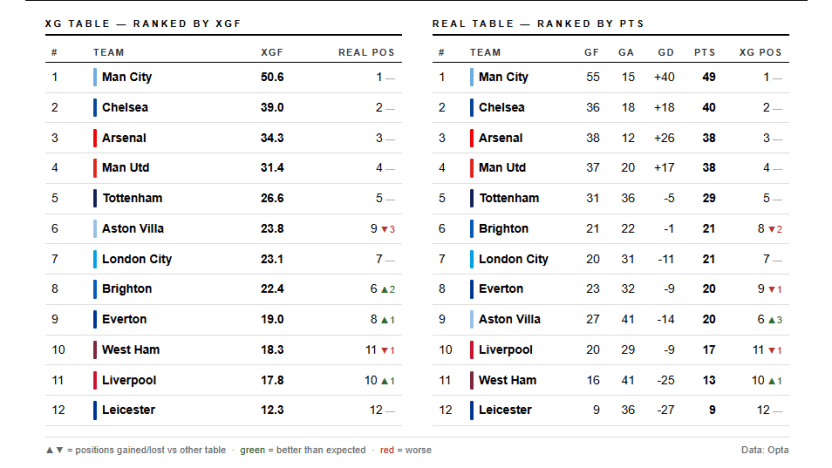
xG measures the probability of a shot becoming a goal, based on the average outcome of similar attempts in the past. But as the City-Spurs game will show us, xG is only the starting point. The real stories emerge when you pair it with other metrics. Before we get there, let's see what xG alone tells us about the full season. And at first glance, the xG table broadly mirrors the BWSL standings - the title challengers, the UWCL spot contenders, and the relegation struggles of Leicester City all fall where you'd expect.
However, xG's potential remains limited if we only use it to measure a team's goal threat. Like every other metric in football, xG is seldom independent of a team’s style of play. And the real story emerges only when you look beneath that surface, pairing xG with conversion rates and shot volume, among other factors. Here, we will try to decode this hidden contextual value of xG when seen as a part of the complete story.
Seven out of ten times, xG gets it right - What happens to the rest?
The most common objection to xG is simple: probability is not the same as a result. True. But here is what the data says. Of the 112 games played across the BWSL this season, 75 results accurately reflect the xG winner of the match. Simply put, xG-based predictions get it right way more often than they get it wrong. A very close numerical approximation of that is when you say - she scores that seven out of 10 times!
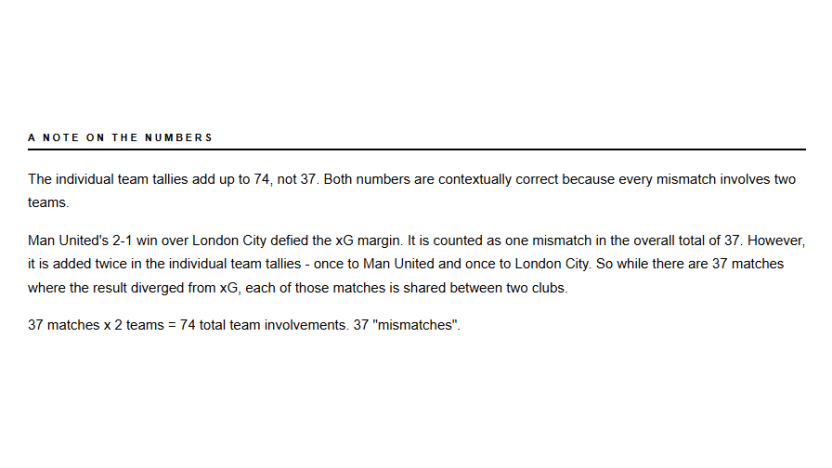
Now let's take a deeper look at the 37 other matches (out of the 112) where xG failed to accurately predict the real result. Let’s call them - ‘mismatches’. These are the games where football diverted from its own logic and they reflect a common fan perception - “We deserved something from this game”. The supporters are innately basing their argument on their team’s xG superiority and they are mostly right to do so.
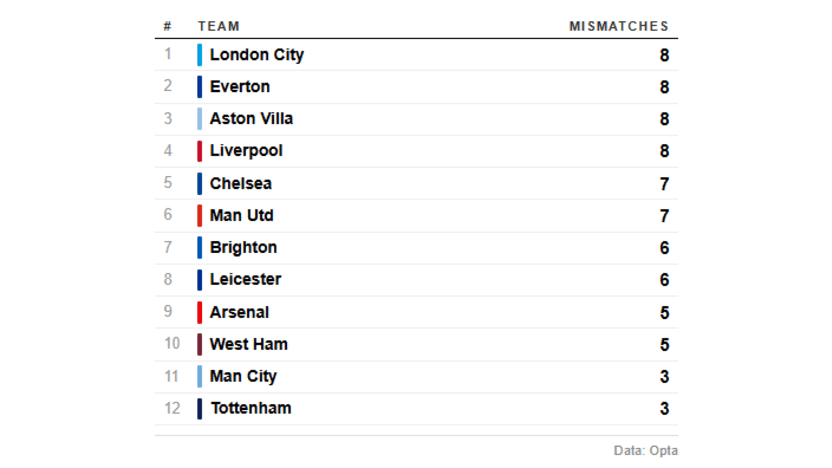
Of the 37 instances of such occurrences, London City, Everton, Aston Villa, and Liverpool have been involved eight times each. Chelsea and Manchester United come next with seven involvements each. Manchester City and Tottenham have the lowest numbers with three entries each.
Analysing the ‘mismatches’ - Who's been lucky, who's been robbed?
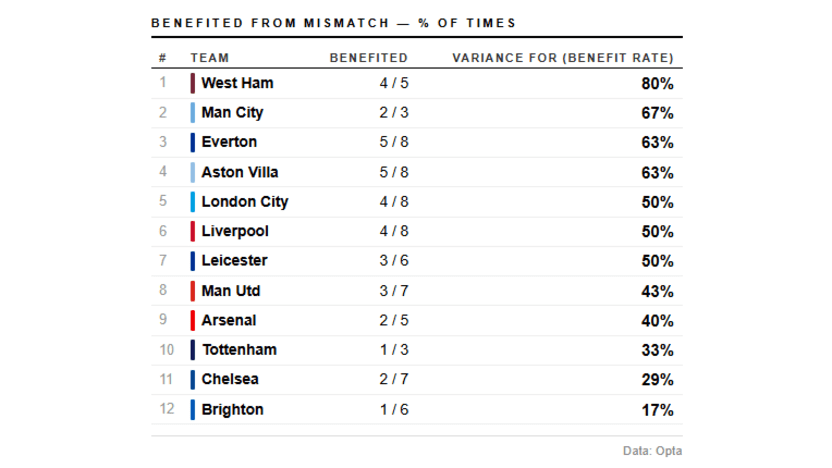
The ‘mismatch’ effect tells a different underlying story. Some teams have been burned more than others due to the ‘mismatch’ effect. Right at the top is Brighton & Hove Albion. They are the league's most wronged side. Of the six games where Brighton strayed from the expected result, they were robbed on five of those occasions and got lucky just the one time.
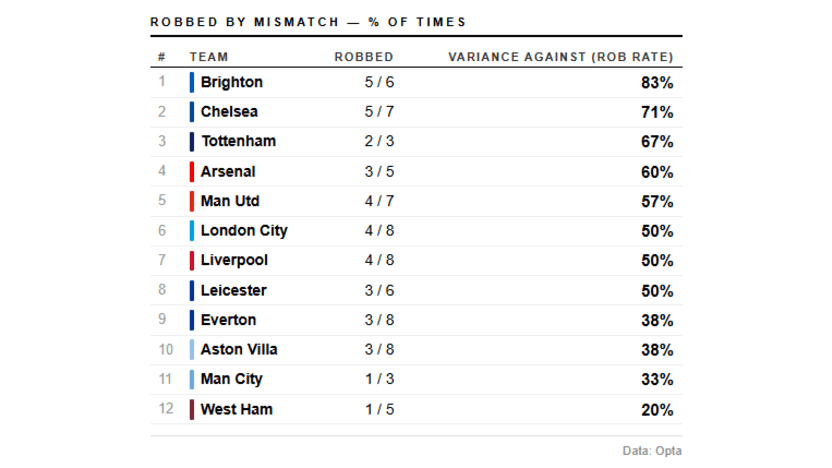
Chelsea come next with five matches going against them despite having xG superiority with just two games rubbing the fortune in their favor. Tottenham Hotspur have ridden their luck just once and suffered twice in their three xG mismatch games.
Arsenal sit fourth, getting robbed thrice and benefitting twice while Manchester United, who took part in seven such games, were left with four results going against them while getting lucky thrice.
London City and Liverpool mirror each other - suffering four such games each while benefitting from the rest. Leicester City show a similar split across fewer (six) games.
Everton and Aston Villa represent the cross-over to the other side. They have both earned more, benefitting from five games and missing out thrice each. League leaders Manchester City have benefitted twice from such instances, getting undone just the once - when they lost to Chelsea in the opening encounter of the season. And finally, it is West Ham United, who have benefitted four times out of their five games with xG mismatches.
The inevitable twist here - every time a team is robbed of points, it is lost to another side, who benefits from the same result. Essentially, it is not just points lost, but gifted to opponents. A good example of this was when relegation candidates West Ham United faced Leicester City.
The Hammers’ 2-1 win against the Foxes saw both sides register an exact xG of 0.54 each. West Ham went on to collect all three points against a direct relegation rival. With Leicester now four points behind safety, the xG result of this game would have reduced the points gap from both directions. Every team deserves a slice of luck, West Ham's might contribute to saving their season.
Could Chelsea or Arsenal have been closer to Man City heading into the final weeks?
From the relegation zone to the title race, every club has a mismatch story. For Chelsea and Arsenal, it reads like a slow-burning nightmare. Man City opened their season with a 2-1 loss to Chelsea, a game where they marginally outdid last season’s champions on xG (City: 1.51 - Chelsea: 1.47). They have not suffered a similar fate since. City have bagged three points in every game they have led on xG post gameweek 1.
The correlation gets contextually stronger once we take a look at Chelsea and Arsenal's record on the same front. Arsenal have dropped six points (via three draws) in their games against Aston Villa, Tottenham Hotspur, and Manchester United. They led xGD (expected Goal Difference, which measures the difference between the chances a team has created and conceded) values by comfortable margins on all three occasions: +1.66 against Villa, +1.6 against Tottenham, +2.35 against Man United.
As for Chelsea, the Blues have dropped a staggering 12 points in games where they have led on xG. Everton and Arsenal defeated Chelsea at home while Man United, London City, and Arsenal again held them to draws in away encounters.
So how would the table look if we measured the top three’s xG performance throughout the season and ranked it based on Opta’s xPTS (expected points) table?
Take a look:
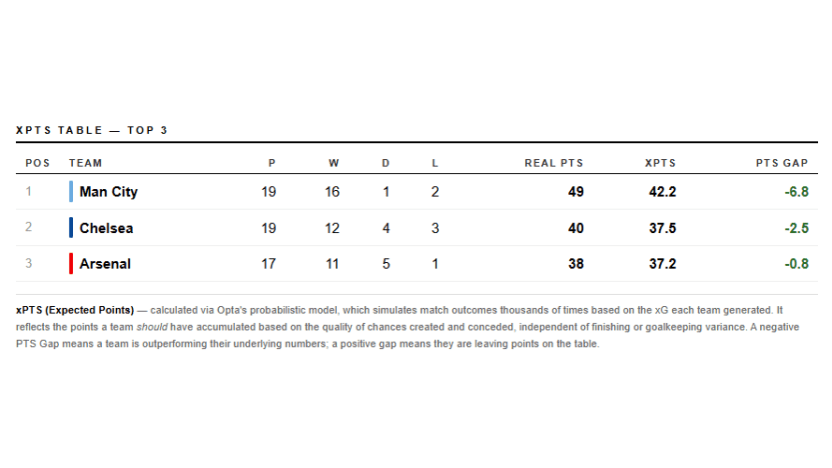
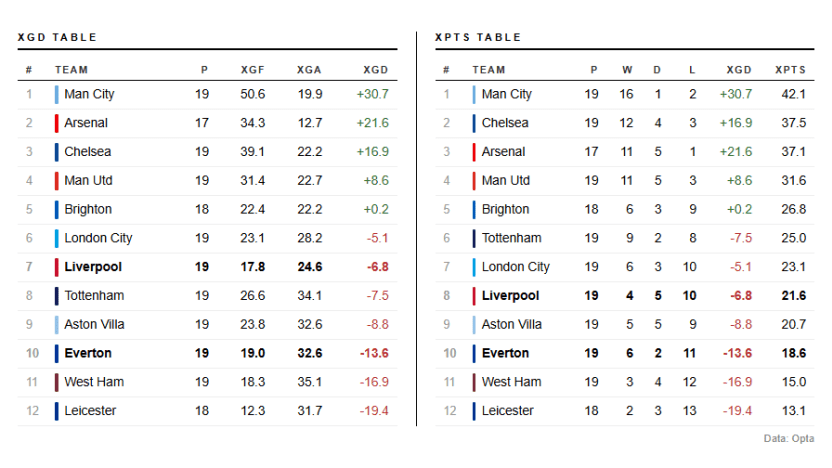
The table here shows that City's nine-point advantage over Chelsea and 11-point cushion against Arsenal (who have two games in hand) has been reinforced by their rivals failing to match the league leaders’ ability to outperform the underlying numbers.
But mismatches alone don’t explain why some teams consistently stay ahead of the numbers - and one team, in particular, has done so all season.
Understanding the brilliance of Man City (explained with xG)
Manchester City appear set to end Chelsea's six-year reign in the Barclays Women's Super League this season. Andrée Jeglertz's team are nine points clear at the top, with three league games left to play this season. Their 55 goal-return in 19 games places them far ahead of other teams, with Arsenal ranking a distant second (netting 38 goals in 17 matches). However, this does not paint the full picture of this City side, who are designed upon efficiency. Defensively, City are the second-best team in the league, conceding 15 goals, three more than Arsenal's tally of 12 conceded, who have played two games less.
City do not only score with threatening regularity but also carry a habit of shutting down the opposition while doing so. They are built to hold possession (third best in the league behind Arsenal and Chelsea), attack with frequency and defend via organization.
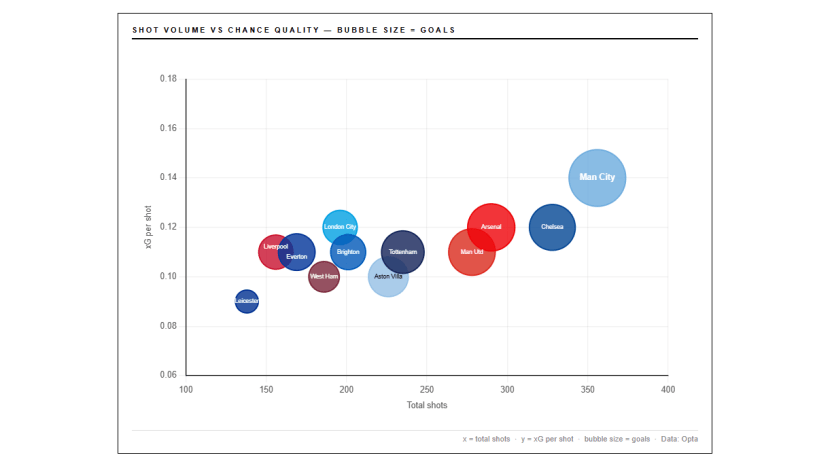
Take a look at the following table, where City leads the league in every single attacking metric: Goals, xG, Total shots, Shots on target, conversion rate (percentage of shots converted into goals), xG/Shot (expected goal probability per attempt).
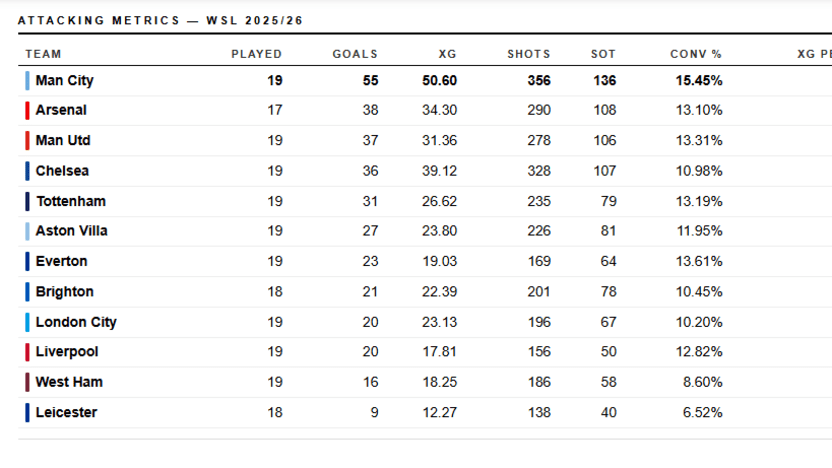
Leading the total shots column (356 so far) shows what we previously assumed, City attack frequently. However, the standard trade-off for a team which loves to have recurring pops at goal is that their chances of scoring from each opportunity (xG per shot) takes a hit. It is because the players are more likely to take on a shot instead of delaying it for a better opportunity to present itself.
Man City, it seems, do not adhere to such barter and therein lies their genius. Despite taking more shots than any other team in the league, they also lead the xG/shot table (0.14), demonstrating their ability to carve out quality chances at a high frequency (shot volume).
Combined together, it allows City to create an exponential increase in goal output. The long-term benefit further enables them to maintain high conversion rates without needing to engage in a hail mary hunt for super goals.
Simply put, Man City’s goals come at a pace and in a system that is consistently replicable over the duration of a season. It is not a story built on a handful of standout nights. In 16 of their 19 games where City have held a positive xGD, the league leaders have won 15 of them. This consistency is what has allowed them to repeatedly outperform their attacking metrics, separating Man City from the rest.
Is there hope for Manchester United to qualify for UWCL?
On the red side of Manchester, Opta predictions have given Manchester United a 1.24% chance to qualify for next season’s UEFA Women's Champions League (UWCL). The Red Devils are currently fourth in the standings, with 38 points accumulated from 19 games. They are level on points with Arsenal (played two games less), who sit above them courtesy of a better goal difference. Chelsea occupy the second spot with 40 points from 19 games, representing a relatively likelier target for Man United to chase for the third and final UWCL spot.


With the Blues set to host Man United on the final matchday, the Red Devils could be presented with an opportunity to enter the game as a virtual knockout for a UWCL spot. Chelsea, courtesy of their ruthless dominance at the top in recent years, have the know-how to deliver at the business end of a campaign. So what positive can the Red Devils take into such a high-stakes encounter?
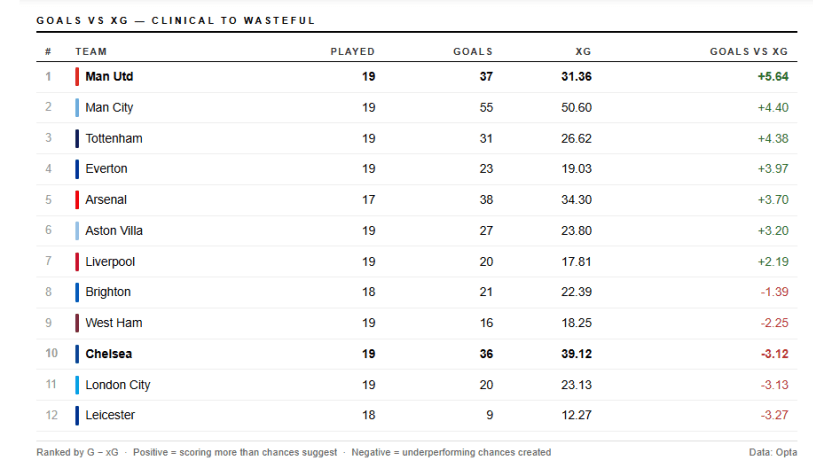
One number offers a low-hanging fruit for United. Chelsea are the only team in the top four who are underperforming their xG. In fact, they rank 10th in the table when it comes to teams underperforming their xG. Chelsea's 36 goals have come from an accumulated xG of 39.12. In comparison, United have netted 37 times from an aggregate xG of 31.36. The table adds further hope when you peek at the top to find United leading the Goals vs xG standings. The Red Devils have outperformed their xG better than any other club in the BWSL this season.
The logical next question is - are these numbers just theoretical probability over the course of a season or have individual games actually played out true to the nature of the xG narrative? Well, Chelsea played Man United back on October 4, 2025 where the Blues outdid the Red Devils on xG by a massive margin - 2.86 to 1.01. Despite racking up an xGD of +1.85 (the Blues’ third-highest in the entire season), Chelsea failed to beat Man United. The game ended in a 1-1 draw. So, United have done it once this season and therein lies their best hope to go one better when the two sides clash again on May 16.
The Merseyside swap: Some results matter more
Man United's UWCL qualification battle sits at the higher end of the table. Lower down, the stakes are different - but the xG story is just as telling.
One game separates Liverpool and Everton this season. Not metaphorically - literally. Had the result of the first Merseyside derby gone any other way, the two sides would be in each other's league positions right now.
Liverpool hosted Everton and lost 4-1. On xG, the Reds were the better side, generating 1.56 against Everton's 0.96. A game Liverpool statistically should not have lost, and in the context of a season where both clubs have precious little to play for, it is the result that has defined the gap between them.
In what has otherwise been a difficult season for Merseyside football, Everton sit eighth, three points ahead of 10th-placed Liverpool.
So have Everton actually been better? The xG table offers a different verdict. Everton have created more xG than Liverpool, but they have also conceded more. Their xGD ranks them 10th in the league, three places below Liverpool's seventh. Opta's xPTS table echoes this: Liverpool on 21.6 points, Everton on 18.5.
The points gap in reality comes down to execution in the handful of games that mattered. Everton won convincingly on xG twice all season - against West Ham and Tottenham. They converted both into actual wins.
Liverpool had four such occasions and won three. The one they didn't? That first derby. The one result that, had it gone differently, would have put the Reds where the Toffees currently sit.
What every team's xG fingerprint reveals
The Merseyside picture is a reminder of something xG does better than other metrics - it tells you who deserved to win. So why does the final result deviate?
The answer lies in finishing quality. The story of a team underperforming or overperforming their xG is directly related to their shooting capabilities. For fans, a great way to analyse their team’s current shortcomings is to take a look at how well they have done when presented with chances.
One such outlier points to Chelsea, who (as mentioned earlier) rank 10th when measured in the xG vs actual goals table. The Blues have not just underperformed their expected goals but done so by a margin bigger than the majority of the league, barring London City and Leicester City to be precise.
Everton, to their credit, rank fourth in this table. While it is comparatively easier for a side banging in goals to keep up the momentum and exponentially convert more chances, the Toffees represent the anomaly here. Their tally of 23 league goals is closer to the bottom-placed teams rather than the table toppers. Regardless, Everton have outdone their xG by +3.97, ranking fourth in the XG vs actual goals table.
Let's now look at the two metrics that sit underneath the xG fingerprints: xG per shot and conversion rate. Man City tops both lists, averaging 0.14 xG/shot and converting at 15.45% - the clearest expression of a side that creates quality chances and then finishes them.
Chelsea sit second in xG/shot at 0.12, but drop to eighth in conversion rate at 10.98%. The gap between those two numbers is the Blues' season in a single statistic - better at manufacturing chances than anyone bar City, consistently failing to take them.
Everton tell the opposite story. They rank towards the bottom in xG/shot but second in conversion rate at 13.61%. Where Chelsea have wasted quality, Everton have squeezed value from limited opportunities. Their finishing efficiency partially explains how they sit above Liverpool in the real table despite inferior underlying numbers.
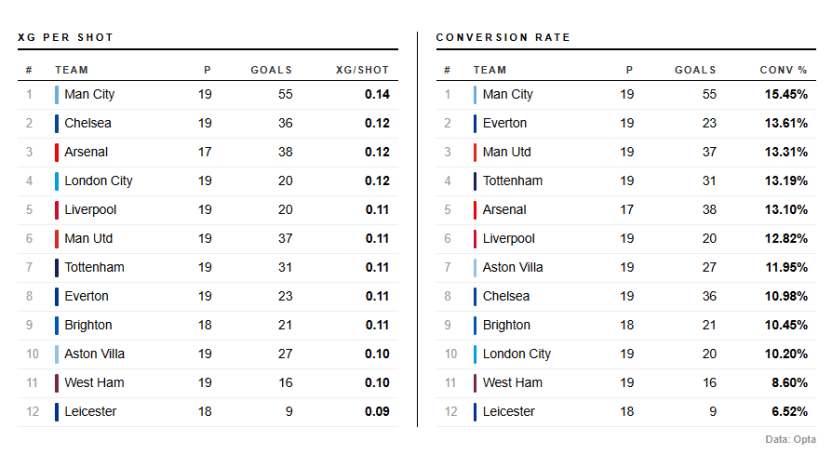
Man United come third in conversion rate table at 13.31%, a notable jump from their seventh spot in the xG/shot standings. Chelsea's stumbles appear to have handed United a faint route to third place and their finishers are currently making the most of it.
They are not alone in this bracket. Aston Villa and Tottenham both rank outside the top half for xG/shot yet punch above that in conversion rate (Villa at 11.95% and Tottenham at 13.19%). For Villa, it partially offsets a chaotic defensive season. For Tottenham, it raises a few concerned eyebrows from the table toppers - Spurs are already converting well from limited quality. What happens when they learn to create better chances too?
London City are the cautionary tale in this section. They rank fourth in xG/shot - creating chances of genuine quality yet converting at just 10.2%, the third worst in the league. They are, in other words, doing the hard part and failing at the easy one.
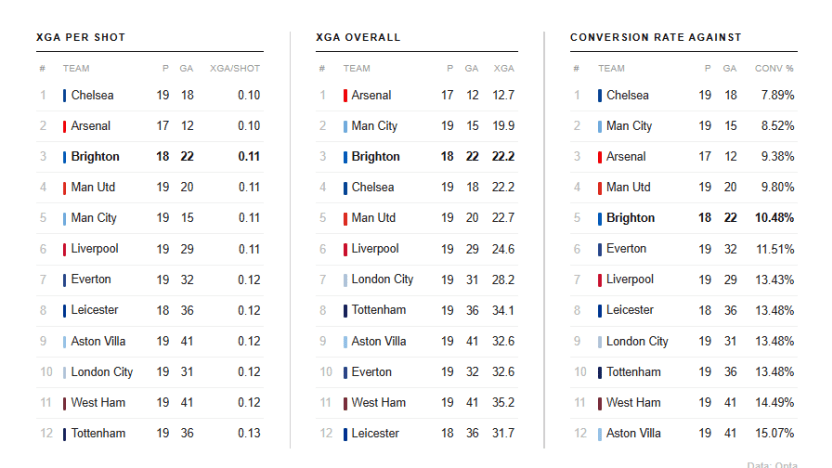
The interesting takeaway here is Brighton's story. Their xGA of 22.18 ranks third in the league. The number holds up on a closer inspection as well, given that their 0.11 xGA/shot (expected goals against per shot) also places them third on the table. They are structured, organised, and difficult to create against. Despite allowing low-quality chances, opponents are converting against them at 10.48%, a rate that outstrips what the quality of those chances should produce.
They are conceding some extra goals that the model says shouldn't be going in. Whether this indicates a pattern in their key defensive actions - positioning at the moment of the shot, goalkeeping abilities, individual lapses, or simply a variance that will correct itself, is worth watching as the season closes. Other teams would be taking the same note as well to find a chink in Brighton’s armor.
Whatever happened to Man City’s 5-2 win against Tottenham?
With xG's relevance now measured across the full season, let's return to the game that opened this discussion. Tottenham racked up an xG of 2.71 against City's aggregate of 2.5.
As premium chances came at a canter, the match was tactically set to be a high-scoring affair - a far cry from City's defensive organisational excellence at the back. With Tottenham creating chances in high volumes (19 shots to City's 14), did the league leaders ride some hard-earned luck to the three points?
The underlying numbers suggest otherwise. Tottenham generated more total xG on the night, yes. And yet City scored five to Tottenham’s two. Despite leading the league in both shot volume and quality of individual chances throughout the season, Jeglertz's team knew what the moment demanded.
On a night when volume was Tottenham's weapon, City answered with quality. Their 0.18 xG/shot made the difference against Tottenham’s 0.14. In simple words, City’s 14 better-crafted chances outdid Tottenham's 19.
The champions elect know: get the basics right, and results follow. What was that old saying - winners make their own ‘luck’?
Word credit: Diptanil Roy