The Barclays Women’s Super League 2 2025/26 season is entering its final stretch, and the stakes are high. With automatic promotion, a playoff place and relegation all still very much up for grabs, the BWSL 2 is shaping up for a compelling run-in to what has been one of its most competitive seasons in recent memory.
At the top of the table, Charlton Athletic have been the story of the season. Karen Hills’ side sit eight points clear at the summit, unbeaten in fifteen games, and are looking increasingly likely to secure their place in the Barclays Women's Super League for the first time.
Admittedly, Charlton's promotion feels almost inevitable, but the battle for that second automatic spot is anything but settled. Birmingham City currently occupy second place, but Bristol City, Crystal Palace and Newcastle United are all breathing down their necks.
With the BWSL expanding, that means more opportunities for promotion. The third-placed BWSL 2 team will enter a playoff against the 12th-placed side in the top flight, so there is potential for three teams to go up from the second tier. With so many clubs tightly packed between third and sixth, the race for that playoff spot is as intense as the fight for second.
At the other end of the table, the picture is equally dramatic. Portsmouth find themselves rooted to the bottom with a -24 goal difference and five consecutive defeats, while Ipswich Town and Sheffield United are also fighting for survival.
In this piece, we will use data to break down the battles defining the BWSL 2 campaign. Through team profiles and player analysis, we examine what the numbers tell us about who could be promoted and who looks set to drop out of the second tier entirely.
Tactical Identities
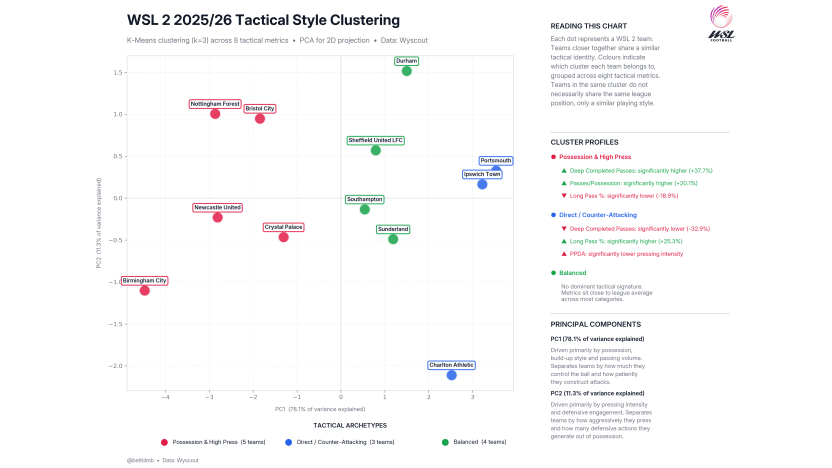
To analyse playing styles across BWSL 2, we used K-Means clustering. This is a statistical method that groups teams together based on similarity across multiple metrics simultaneously. Rather than judging teams on a single stat, it factors in eight tactical variables at once, including possession, pressing intensity, passing style and defensive engagement. Principal Component Analysis (PCA) is then used to plot these groupings in two dimensions so we can identify each team’s style of play.
The data paints a picture of the league. We can see that Nottingham Forest, Newcastle United, Birmingham City, Crystal Palace and Bristol City look to control the ball and press aggressively to win it back.
Forest lead the league for possession at 59.8%, with Crystal Palace (55.84%), Birmingham City (57.4%), Newcastle United (57.97%) and Bristol City (53%) all enjoying an above-average share of possession.
Crystal Palace have the lowest PPDA in the division at 7.11, indicating they are the highest pressing side in the league. Whilst Birmingham (7.38) and Nottingham Forest (7.39) are close behind, pressing significantly more than the league average of 9.40.
The most tactically interesting story in this cluster is Birmingham City, who by almost every metric should be top of the table. Their average PPDA of 7.38 is the second lowest in the league, and they average more positional attacks per game than anyone else in the division. Yet if we look at the table, they sit eight points behind Charlton.
The Addicks have mastered their counterattacking style. They average 41.3% possession, the lowest in the league, and a long pass percentage of 17.1%, second only to Portsmouth. On paper, that looks like a team under the cosh. In reality, they are a side that is comfortable sitting deep, inviting pressure and waiting for the moment to strike, and when that moment comes, they are ruthless. Given that they are top of the league and currently unbeaten, this proves that counter-attacking football, when executed well, can be just as effective as any high-press system.
Alongside Charlton, Portsmouth and Ipswich Town are the league's most direct sides. All three average below 42% possession and rank as the top three for long pass percentage in the division.
For Portsmouth and Ipswich, who sit at the bottom of the table, this directness appears to reflect a lack of quality in possession rather than a deliberate plan.
The remaining four teams, Durham, Sheffield United, Southampton and Sunderland, sit in the middle ground, without a strong tactical identity in either direction. Their metrics cluster around the league average across almost every category.
The balanced cluster is not a criticism; there are plenty of sides who thrive without a rigid tactical identity, often adapting to opponents rather than imposing themselves. Whether that adaptability will help them as the season draws to a close is something only time will tell.
The Key Players
In this section, we will take a closer look at the individuals likely to shape the outcome of BWSL 2's defining battles. Using player-level data, we can identify standout performers in key metrics, highlighting those outperforming their peers and identifying which players could prove decisive between now and the end of the season.
Before we dive in, how does this data analysis actually work?
A simple scatterplot, such as goals versus xG, progressive passes versus progressive runs, tells us one story. It's a useful story, but it's only ever one singular piece of information like ‘which player is the best ball progressor’. To build a complete picture of who's actually standing out in Barclays WSL 2 this season, we would need to plot seven, eight, or nine different combinations per position group, then somehow hold them all in our heads at once.
Instead, these charts use a combination of PCA and Isolation Forest across all metrics simultaneously. PCA takes all seven or eight metrics for a position group, finds the two directions in that data that best capture how players differ, and projects everyone onto a single plot.
The axes are blends of everything, weighted by what the data says actually separates players in that group. Isolation Forest then identifies which players are hard to place because their overall profile across all metrics looks unlike anyone else in their position group.
The chart below each scatter explains the why; it shows us exactly which numbers are driving each player's unusual profile.
Forwards
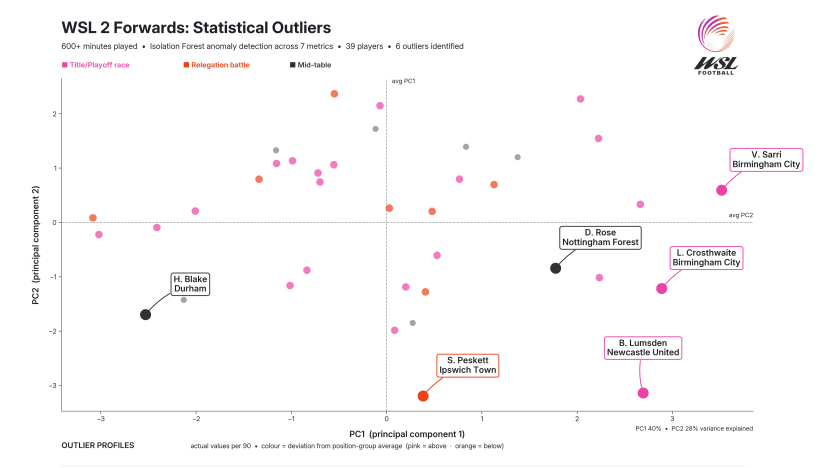
The scatter here is a map of the division itself. The cluster of pink dots pushing to the right along are our title race forwards, racking up higher overall attacking involvement across the board. The orange relegation dots are more to the left of centre, suggesting lower output across the board. This is to be expected. Birmingham are averaging 2.71 goals per game this season, while Portsmouth average 1.21.
The outliers, though, are where it gets interesting.
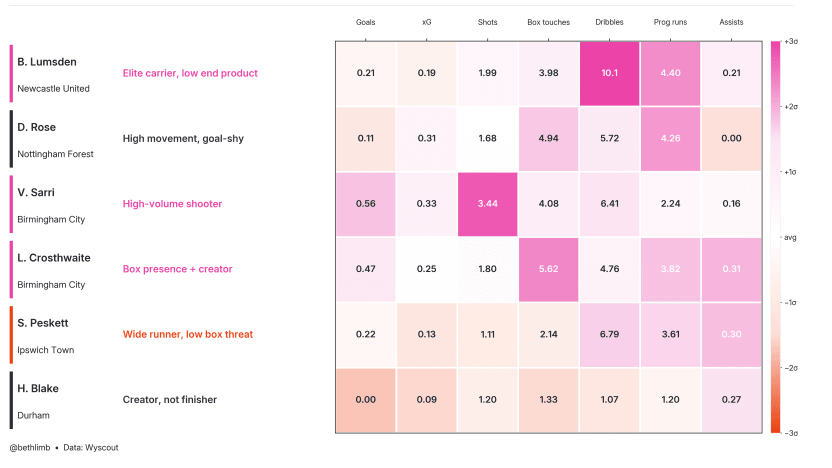
Beth Lumsden (Newcastle United) is the most ‘extreme’ attacking player in the division. The winger, who is capable of playing on either flank, averages 10.1 dribbles per 90, nearly three times the position average of 3.03, and 4.40 progressive runs per 90. From this, we can immediately understand that she is primarily a ball carrier, with absolutely everything else second.
Newcastle’s tactics involve a high press - they have an average PPDA of 8.16 and average 91.71 recoveries per 90. Lumsden can be the engine of that system, averaging 6.07 ball recoveries per 90, with 60% of them in the opposition half.
We can see that the 26-year-old often frequents the penalty area, averaging 3.98 touches there per 90. Moreover, this clearly translates into shots as she averages 1.99 per 90. What the data also shows is that these shots don’t translate into goals or high-value chances, as shown by her 0.21 goals and 0.19 xG.
Veatriki Sarri (Birmingham City) plays across the left and occasionally as a centre forward. Birmingham have netted 38 goals in 14 games, and Sarri is clearly getting into goalscoring positions, having bagged seven goals herself so far this season.
Her 3.44 shots per 90 is the highest in the entire forward group, with 6.41 dribbles and 4.08 box touches. We can see that she repeatedly arrives in the right areas, backs herself, wants the ball in dangerous situations, and isn't shying away from taking her opportunities. The finishing backs it up, too; she averages 0.56 goals per 90 from just 0.33 xG, which means she's converting above expectation.
Furthermore, her teammate Lily Crosthwaite is the complete package at the other end of Birmingham's attack. The 23-year-old averages 5.62 box touches per 90, the highest in the outlier group; 4.76 dribbles; 3.82 progressive runs; 0.47 goals; and 0.31 assists. In short, she does almost everything. Between them, Sarri and Crosthwaite represent what a title-chasing attack looks like.
The other three are worth understanding properly before drawing any conclusions, because context does a lot of heavy lifting here.
Deanne Rose (Nottingham Forest) has played right across the front line this season. She is a dynamic ball carrier averaging 5.72 dribbles, 4.26 progressive runs and 4.94 box touches per 90. The numbers show that she is consistently getting into the right areas. However, her 0.11 goals from 1.68 shots stand out. This suggests that Rose is willing to take shots, but they aren’t always translating into goals.
Sophie Peskett (Ipswich Town) might be the player in this entire dataset most deserving of a second look from a recruitment perspective. Her 6.79 dribbles, 3.61 progressive runs, and 0.30 assists per 90 indicate a player doing everything right in terms of creativity and carrying.
She has been the bright spark for Ipswich this season; her numbers tell the story of a dynamic, direct attacker in an Ipswich side that has struggled to find its feet in the BWSL 2 this season.
She runs at defenders, carries the ball into dangerous areas, and creates chances in a team that otherwise struggles to generate them. In a different context, those are qualities that would make her one of the most exciting forwards in the division.
Hannah Blake (Durham) is perhaps the most intriguing here. The data has highlighted her as it doesn’t quite know where to place her. She is actually Durham's most creative player (not just among the forwards, but across the entire squad). She leads the club in xA, assists per 90 and key passes per 90, and has done so across 676 minutes.
Her 0.27 assists per 90 against a group average of 0.13 shows she is a facilitator in a mid-table Durham side that can lack a cutting edge - their 0.91 xG per 90 is the second-lowest in the league.
This is exactly where the method earns its keep. On a conventional goals versus xG scatter, we would scroll past Hannah Blake without a second look. By viewing seven metrics simultaneously, we can gain a clearer picture of her profile and see that she leads her club in creativity, which is precisely why she appears here.
Midfielders
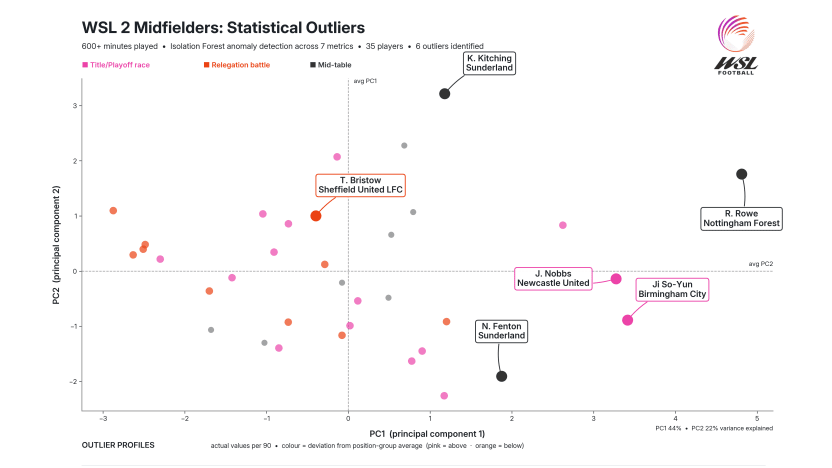
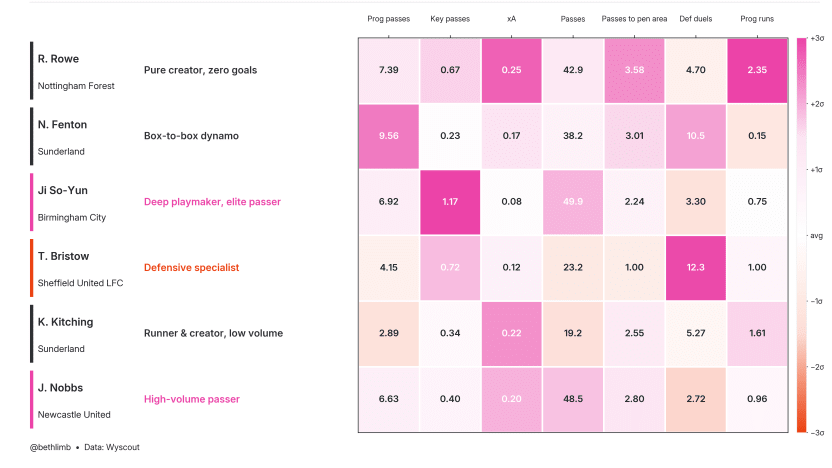
Now, we can see where BWSL 2's tactical identities really diverge. Here, we’ve got playmakers at one extreme, and defensive destroyers at the other, and everything in between. We can see that the outlier group contains all of them, which is exactly what you'd expect from a position group this varied across the division.
Ji So-Yun (Birmingham City) is, or rather, was operating on a different plane to almost everyone else. During her time with The Blues, she averaged 1.17 key passes per 90 (well above the group average of 0.25). Although she only managed to register a couple of assists, her creativity was so important to Birmingham’s early-season form. It will be interesting to see if her departure has any influence over the second half of the season for Amy Merricks’ side.
Tilly Bristow (Sheffield United LFC) is the outlier that really stands out in the group, and possibly in the entire dataset. She averages 12.31 defensive duels per 90 - the highest of any midfielder in the division. This tells us that she is fighting for everything, contesting every second ball, throwing herself into challenges at a rate that speaks to both her quality and the situation she's operating in.
The problem is what comes next: 23.18 passes per 90 against and just 1 pass to the penalty area per 90. Whilst she is just one player, it does indicate wider issues with The Blades this season. These numbers tell us that the young midfielder battles for everything. This shows brilliant tenacity and work rate; it suggests that Sheffield United are a team that struggles to retain possession, which can be exploited in transition.
The rest of the group fills in the picture. Natasha Fenton (Sunderland) is perhaps the most complete midfielder in the outlier group. She averages 9.56 progressive passes, showcasing her ability to orchestrate play in the middle of the park. Her teammate, Kaite Kitching, is almost the inverse of Fenton; she makes only 19.21 passes per 90 but averages 0.22 xA and 1.61 progressive runs, suggesting a high level of directness about her style.
Furthermore**, Rachel Rowe (Nottingham Forest)** averages 42.87 passes per 90 and 3.58 passes to the penalty area, showcasing her ability to progress the ball. While Jordan Nobbs (Newcastle United) posts 48.55 passes per 90 and 2.80 passes to the penalty area, utilising her exceptional passing ability in Newcastle’s midfield.
Defenders
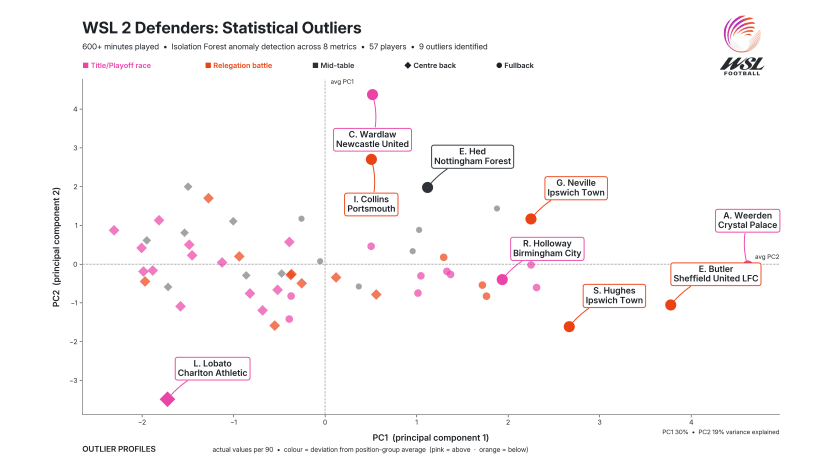
A quick note: circles are fullbacks, diamonds are centre backs. It matters here because the group contains both, and it's immediately obvious from the scatter that fullbacks are doing the heavy lifting in terms of variance. Eight of the nine outliers are fullbacks, which suggests the position is being used in radically different ways across the division, from aggressive crossing outlets to press-heavy interceptors.
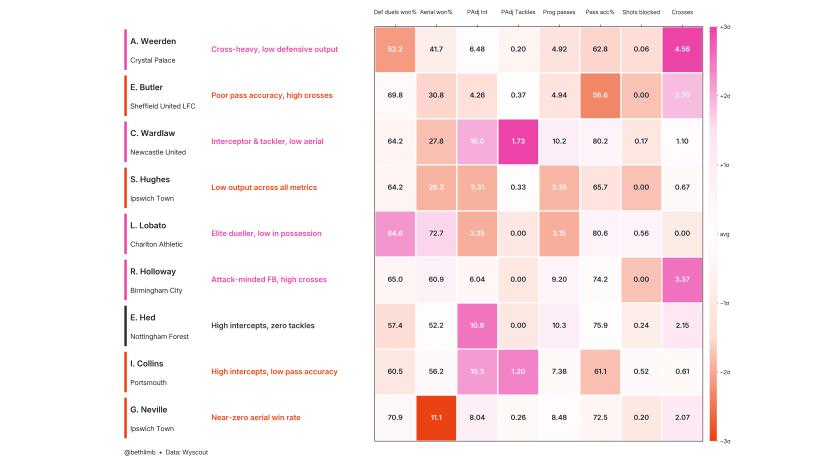
Lucia Lobato (Charlton Athletic) is the only CB in the outlier group, and her numbers explain why. The Irish defender averages a 84.62% defensive duel win rate and a 72.73% aerial duel win rate. She is, by every physical contest metric, the most dominant defender in the division this season. Charlton are leading the title race, and Lobato is their defensive foundation.
Given their counterattacking style, it’s perhaps no surprise that she averages 3.15 progressive passes per 90 against a group average of 7.92. She wins everything and then, largely, keeps it simple, playing safe passes to teammates.
Ebba Hed (Nottingham Forest) is the most quietly impressive fullback in the outlier group. The Swede averages 10.91 possession-adjusted interceptions (the highest of any defender in the entire merged group of defenders).
What is particularly impressive is her 10.28 progressive passes per 90 and 75.86% pass accuracy. She reads the game, wins the ball back through anticipation rather than aggression, and drives it forward cleanly.
Zero PAdj sliding tackles indicate that she never throws herself into challenges simply because she doesn't need to; she's already in the right position before the ball arrives. For a Forest side that dominates possession, Hed is exactly the profile you'd want at left back.
The rest of the outlier group is a study in contrasts, and again, context does a lot of work. Charlotte Wardlaw (Newcastle United) is posting 10.00 PAdj interceptions and 1.73 PAdj tackles, indicating a defender who has the ability to ensure she is in the right place at the right time to make vital interceptions.
Dutch defender Ashleigh Weerden (Crystal Palace) is the tactical opposite. Her numbers suggest something of a flying wing-back. She averages 4.56 crosses per 90 against a group average of 0.89. Her four goals and six assists showcase how important she is to Palace from an attacking perspective. Additionally, her 6.48 interceptions per 90 and 4.8 recoveries show she’s willing to do the defensive graft as well.
Summer Hughes and Grace Neville's (both Ipswich) outputs are both symptomatic of the wider defensive issues at Ipswich. Hughes is below average across almost every metric, while Neville has an aerial win rate of 11.11%, the lowest among defenders in the division.
Conclusion
Data is important as it resists the temptation to flatten. Looking at the table, we can see the obvious: Birmingham are good, Portsmouth are struggling, and the promotion race looks like exactly that. Those things are true, and they matter. Those teams are made of individuals, each operating within a specific context that shapes what their numbers mean and what they don't.
The players who appear in these charts are not all outliers in the same way. Some are clearly exceptional, such as Ji So-Yun and Lucia Lobato. Others, such as Sophie Peskett and Hannah Blake, are players who may have gotten overlooked, purely based on their team’s positions in the table.
We have seen that title-chasing sides have vulnerabilities and relegation-threatened sides have players capable of influencing games. With the season beginning to wind down, small margins matter more than ever, and the players highlighted here are the ones who are most likely going to have the biggest impact in the battles at both ends of the table.